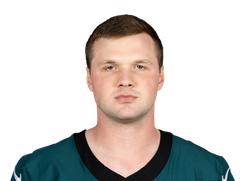

+15639.1%39¢
sim fair price
U
+19034.5%34¢
 +4.6% sim edge
sim 39.1% · market 32.7%
+4.6% sim edge
sim 39.1% · market 32.7%
A sim fair price for every NFL passing touchdown line a venue is quoting, against the best live price, fees included.
The three players with the biggest sim edge, one prop each. The big number on each row is its The price a prop would carry with no margin, worked out from thousands of simulated games instead of from the market.More →; the The sim's probability that a bet wins minus the break-even probability of the best live price, after any fee.More → is measured against the best live price after fees.
+15639.1%39¢
sim fair price
+4.6% sim edge
sim 39.1% · market 32.7%
-17763.9%64¢
sim fair price
+1.9% sim edge
sim 63.9% · market 62.5%
+10449%49¢
sim fair price
 +1.5% sim edge
sim 49.1% · market 49.0%
Free accounts see the top three players. Premium unlocks every simulated prop, every line on the ladder and the market, side and sim edge filters.
Go Premium4,318
NFL lines priced by the last run; 245 agree closely enough with the market to rank
+4.6%
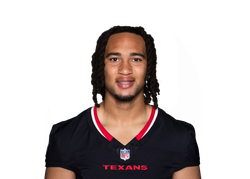
CJ Stroud Under Passing Touchdowns u1.5
Each NFL player's stat line is simulated 5,000 times. The middle of each simulation is the player's projection; the spread comes from his last 20 game logs, pulled toward a typical spread for his position and market when the sample is short. Players in the same game share a game shock and teammates share a team shock, so a big passing day lifts his receivers too, and combined markets are added up inside each simulation so they keep that link.
The share of simulations that clear a line is the sim probability, and the price that probability implies with no margin is the sim fair price. The sim edge is the sim probability minus the break-even probability of the best live price at your books, after any exchange fee. A push is treated as a refund.
A prop is ranked only when the market has its own no-vig price for it and the sim lands within 10 points of it, the sim probability is between 20% and 80%, the simulated stat has a real spread, and the best price was updated in the last 10 minutes. Longshots and thin yes/no lines are where a model is least reliable, so they still get a sim price on the player's ladder but no edge, and they never headline the board. A sim edge of 15% or more is also left off as a likely bad input.
The last run finished . Sims re-run every 20 minutes before games start; prices are read live on every page load. Late injury news, a role change after the last run and short game logs are the main limits. This is a model, not a guarantee. See how accurate the sims have been.
As of 4:00 PM ET on Nov 17, 2026, the latest NFL run has 12 passing touchdown props with a market consensus to check against, each from 5,000 simulated games. It is a model, not a guarantee. Right now the biggest sim edge is CJ Stroud Passing Touchdowns under 1.5 at Novig, +4.6%, with a sim fair price of +156.
Touchdown passes are drawn as whole numbers from a count distribution, so the sim gives a real chance of zero as well as of three or more.
The center of every simulated stat line is BeatVig's NFL projection for that player, and the spread around it comes from his last 20 game logs. When he has only a few games on file, the spread is pulled toward what is typical for his position and market, so a backup with two starts does not get a wild range.
Each run plays the week out 5,000 times. Players in the same game share a game shock, so a shootout lifts both offenses, and teammates share a team shock, so a big day for the quarterback carries his receivers with it. Combined markets such as rushing plus receiving yards are added up inside each simulated game, so they keep those links.
Sims re-run about every 20 minutes before kickoff and only price lines that a sportsbook or exchange is quoting right now. Ruled-out players are dropped before the run starts.
BeatVig shows two fair prices on NFL props, and they come from different places. The market fair price takes a sharp venue's own two-sided price and strips out its margin, so it tells you what the betting market believes. The sim fair price ignores the market and asks what the projection and the player's history say the line is worth.
When the two agree, a price that beats both deserves a closer look. When they disagree, the gap is information: the market may know something the projection does not, such as late injury news, or the projection may see something the line has not caught up to. A prop where the two sit more than 15 points apart is held off the board as a likely bad input.
Step 1
Set the sportsbooks and exchanges you can bet at. Every best price and sim edge on the board is measured against those venues only.
Step 2
Rows are ranked by sim edge: the sim's probability minus the break-even probability of the best price after fees.
Step 3
Where the market fair probability is shown, compare it with the sim. A row where both sit above the price is stronger than one where only the sim does.
Step 4
The sim cannot see an injury report or depth chart change that landed after its last run, so check the run time and the latest NFL news first.
Touchdown passes are drawn as whole numbers from a count distribution, so the sim gives a real chance of zero as well as of three or more. Each line a venue quotes gets its own sim probability from 5,000 simulated games.
BeatVig counts the share of 5,000 simulated games where the player goes over the line, treats a push as a refund, and converts that probability to American odds with no margin added.
De-vigged fair odds remove the margin from a sharp market's own price, so they show what the market thinks. A sim fair price comes from the projection and game logs alone, so it can disagree with the market, and that disagreement is the reason to look at both.
Yes. For an exchange, the sim edge is measured against the price after that venue's trading fee, the same way BeatVig's other boards net out fees, so an exchange row is never flattered by a fee it would really charge.
Partly. A free account sees the three players with the biggest sim edge, one prop each. Premium, $24.99 a month or $99.99 a year, opens every simulated prop, every line on the ladder and the filters.