
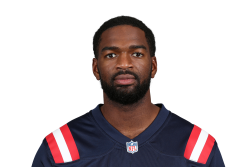
Jacoby Brissett

QB · ARI · team page

Unlock 14 more markets
Free accounts see Jacoby Brissett’s headline market. Premium unlocks every market, every book, for every player.
Go PremiumSelected prop
Passing Yards
Line
o/u 258.5
Over at o/u 258.5
 ProphetX
Under at o/u 258.5
 Pinnacle
- Projection
- 259.8 yds
- Consensus
- -11653.7%54¢
- Range
- 47.5–399.5
Where to bet
21 lines · every venue we track
ProphetX
EV -3.3% · L10 4/10 · All 11/28
EV +16.2% · L10 5/10 · All 14/28
Tick marks the line most venues quote.
- Best O
- -11653.7%54¢
- Best U
- ———
- Hit rate vs 47.5
- 25/28
L3 3/3 L5 5/5 L10 10/10 L20 19/20 All 25/28
Sportsbooks
| Venue | Over | Under |
|---|---|---|
| Courtside | -11653.7%54¢ | ——— |
- Best O
- ———
- Best U
- -11453.3%53¢
- Hit rate vs 48.5
- 25/28
L3 3/3 L5 5/5 L10 10/10 L20 19/20 All 25/28
Sportsbooks
| Venue | Over | Under |
|---|---|---|
| Courtside | ——— | -11453.3%53¢ |
- Best O
- ———
- Best U
- +29403.3%3¢
- Hit rate vs 124.5
- 22/28
L3 3/3 L5 5/5 L10 9/10 L20 18/20 All 22/28
Sportsbooks
| Venue | Over | Under |
|---|---|---|
| Rebet | ——— | +29403.3%3¢ |
- Best O
- ———
- Best U
- +16215.8%6¢
- Hit rate vs 149.5
- 20/28
L3 3/3 L5 5/5 L10 9/10 L20 18/20 All 20/28
Sportsbooks
| Venue | Over | Under |
|---|---|---|
| Rebet | ——— | +16215.8%6¢ |
Prediction Markets
| Venue | Over | Under | Implied % |
|---|---|---|---|
 Polymarket |
——— | +37621%21¢ |
- Best O
- -80989%89¢
- Best U
- +80911%11¢
- Hit rate vs 174.5
- 17/28
L3 3/3 L5 4/5 L10 8/10 L20 17/20 All 17/28
Sportsbooks
Prediction Markets
| Venue | Over | Under | Implied % |
|---|---|---|---|
 Kalshi |
-80989%89¢ | +56715%15¢ | 89% |
|
Polymarket
|
-90090%90¢ | +48817%17¢ | 90% |
- Best O
- -42681%81¢
- Best U
- +40719.7%20¢
- Hit rate vs 199.5
- 17/28
L3 3/3 L5 4/5 L10 8/10 L20 17/20 All 17/28
Sportsbooks
Prediction Markets
| Venue | Over | Under | Implied % |
|---|---|---|---|
|
Kalshi
|
-42681%81¢ | +40020%20¢ | 81% |
|
Polymarket
|
-45682%82¢ | +28526%26¢ | 82% |
- Best O
- -22369%69¢
- Best U
- +20932.4%32¢
- Hit rate vs 224.5
- 14/28
L3 2/3 L5 3/5 L10 5/10 L20 14/20 All 14/28
Sportsbooks
Prediction Markets
| Venue | Over | Under | Implied % |
|---|---|---|---|
|
Kalshi
|
-22369%69¢ | +20333%33¢ | 69% |
|
Polymarket
|
-23370%70¢ | +19434%34¢ | 70% |
- Best O
- -13858%58¢
- Best U
- +12744.1%44¢
- Hit rate vs 249.5
- 12/28
L3 2/3 L5 3/5 L10 4/10 L20 12/20 All 12/28
Sportsbooks
Prediction Markets
| Venue | Over | Under | Implied % |
|---|---|---|---|
|
Kalshi
|
——— | +12744.1%44¢ | |
|
Polymarket
|
-13858%58¢ | +11746.1%46¢ | 58% |
- Best O
- ———
- Best U
- -21368.1%68¢
- Hit rate vs 254.5
- 12/28
L3 2/3 L5 3/5 L10 4/10 L20 12/20 All 12/28
Sportsbooks
| Venue | Over | Under |
|---|---|---|
 Novig |
——— | -21368.1%68¢ |
- Best O
- -11553.5%53¢
- Best U
- -11553.5%53¢
- Hit rate vs 255.5
- 12/28
L3 2/3 L5 3/5 L10 4/10 L20 12/20 All 12/28
Sportsbooks
| Venue | Over | Under |
|---|---|---|
 Fanatics Sportsbook |
-11553.5%53¢ | -11553.5%53¢ |
- Best O
- -12255%55¢
- Best U
- -11854.1%54¢
- Hit rate vs 257.5
- 12/28
L3 2/3 L5 3/5 L10 4/10 L20 12/20 All 12/28
Sportsbooks
| Venue | Over | Under |
|---|---|---|
 BetRivers |
-12255%55¢ | -11854.1%54¢ |
- Best O
- -10751.7%52¢
- Best U
- -11252.8%53¢
- Hit rate vs 258.5
- 11/28
L3 2/3 L5 3/5 L10 4/10 L20 11/20 All 11/28

- Best O
- -11052.4%52¢
- Best U
- -12054.5%55¢
- Hit rate vs 260.5
- 11/28
L3 2/3 L5 3/5 L10 4/10 L20 11/20 All 11/28
Sportsbooks
| Venue | Over | Under |
|---|---|---|
|
Fanatics Sportsbook
|
-11052.4%52¢ | -12054.5%55¢ |
- Best O
- -13557.4%57¢
- Best U
- -17864%64¢
- Hit rate vs 261.5
- 10/28
L3 2/3 L5 3/5 L10 4/10 L20 10/20 All 10/28
Sportsbooks
| Venue | Over | Under |
|---|---|---|
|
Novig
|
-13557.4%57¢ | -17864%64¢ |
- Best O
- -11052.4%52¢
- Best U
- -13256.9%57¢
- Hit rate vs 264.5
- 10/28
L3 2/3 L5 3/5 L10 4/10 L20 10/20 All 10/28
Sportsbooks
| Venue | Over | Under |
|---|---|---|
|
BetRivers
|
-11052.4%52¢ | -13256.9%57¢ |
- Best O
- +13342.9%43¢
- Best U
- -14459%59¢
- Hit rate vs 274.5
- 8/28
L3 1/3 L5 2/5 L10 3/10 L20 8/20 All 8/28
Sportsbooks
Prediction Markets
| Venue | Over | Under | Implied % |
|---|---|---|---|
|
Kalshi
|
+13342.9%43¢ | -14459%59¢ | 43% |
|
Polymarket
|
+12744.1%44¢ | -15060%60¢ | 44% |
- Best O
- +30025%25¢
- Best U
- -25772%72¢
- Hit rate vs 299.5
- 4/28
L3 0/3 L5 0/5 L10 0/10 L20 4/20 All 4/28
Sportsbooks
Prediction Markets
| Venue | Over | Under | Implied % |
|---|---|---|---|
|
Kalshi
|
+23330%30¢ | -25772%72¢ | 30% |
|
Polymarket
|
+22331%31¢ | -27073%73¢ | 31% |
- Best O
- +56815%15¢
- Best U
- -48883%83¢
- Hit rate vs 324.5
- 1/28
L3 0/3 L5 0/5 L10 0/10 L20 1/20 All 1/28
Sportsbooks
Prediction Markets
| Venue | Over | Under | Implied % |
|---|---|---|---|
|
Kalshi
|
+40020%20¢ | -48883%83¢ | 20% |
|
Polymarket
|
+37621%21¢ | -52584%84¢ | 21% |
- Best O
- +73312%12¢
- Best U
- -101191%91¢
- Hit rate vs 349.5
- 1/28
L3 0/3 L5 0/5 L10 0/10 L20 1/20 All 1/28
Sportsbooks
Prediction Markets
| Venue | Over | Under | Implied % |
|---|---|---|---|
|
Kalshi
|
+73312%12¢ | -101191%91¢ | 12% |
|
Polymarket
|
——— | -115092%92¢ |
- Best O
- +24843.9%4¢
- Best U
- -190095%95¢
- Hit rate vs 374.5
- 1/28
L3 0/3 L5 0/5 L10 0/10 L20 1/20 All 1/28
Sportsbooks
Prediction Markets
| Venue | Over | Under | Implied % |
|---|---|---|---|
|
Kalshi
|
+10119%9¢ | -190095%95¢ | 9% |
Game log
Most recent first · Passing Yards
| Date | Opp | Passing Yards | Vs 258.5 |
|---|---|---|---|
| Oct 25 | vs DEN | 272.0 | Hit |
| Oct 18 | @ LAR | 218.0 | Miss |
| Oct 11 | vs DET | 292.0 | Hit |
| Oct 4 | @ NYG | 166.0 | Miss |
| Sep 27 | @ SF | 280.0 | Hit |
| Sep 20 | vs SEA | 95.0 | Miss |
| Sep 13 | @ LAC | 277.0 | Hit |
| Jan 4 | @ LAR | 243.0 | Miss |
| Dec 28 | @ CIN | 212.0 | Miss |
| Dec 21 | vs ATL | 203.0 | Miss |